The company and the moment
Localiza does not only rent cars. It sells them afterwards.
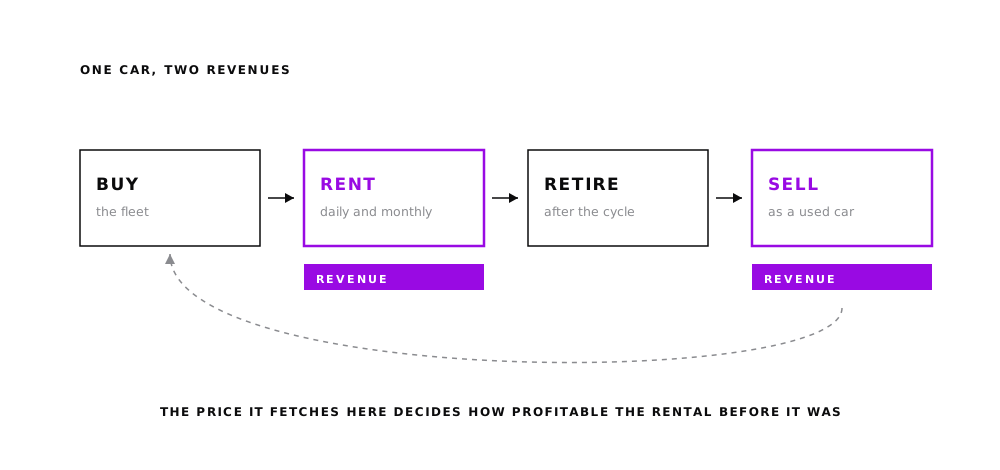
Localiza&Co is one of the largest companies in Brazil and one of the ten most valuable. Its business has two halves that feed each other: renting cars, and then selling those same cars as used vehicles once they leave the fleet.
That second half is not a footnote. The price a car fetches when it leaves the fleet decides how profitable the rental that came before it really was. When used-car prices move, the whole company moves with them.
The problem
A cycle gave, then a cycle took it back.
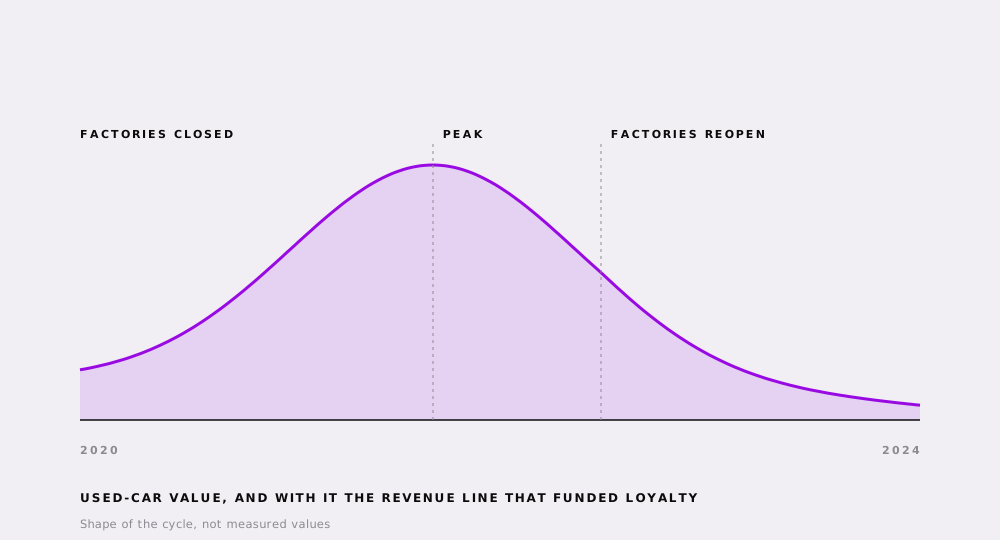
During the pandemic, car factories closed. New cars stopped arriving, and used cars became scarce and expensive. Every vehicle leaving Localiza's fleet was worth more than anyone had planned for, and revenue rose on the back of it.
Then the factories reopened. New cars returned to the market, used-car prices fell back, and the line that had been carrying the results stopped carrying them. The company went looking for costs to cut.
The loyalty programme was one of the first things on that list. It has the profile budget reviews punish: the spend is immediate and visible, the return is spread across months and shows up inside other people's numbers. It stopped being read as an investment and started being read as a cost.
The proof
Three million customers, one question.
If the programme really created value, then customers who engaged with it should be worth measurably more than customers who never did. Not felt to be worth more. Measured.
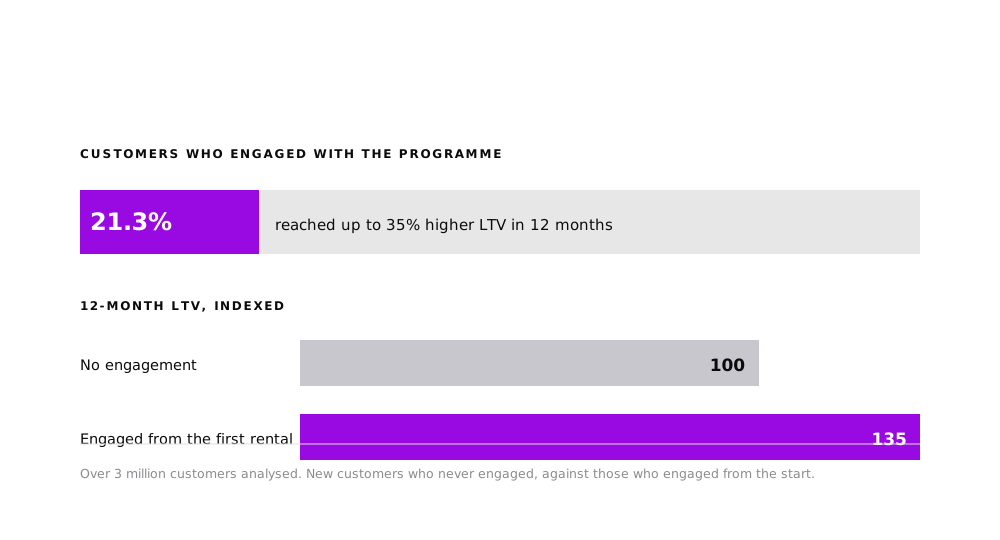
I built the study around new customers only, so that tenure could not explain the gap. Two groups, same starting point: customers who engaged with the programme inside their first thirty days, against customers who entered in the same intake window and never engaged at all. The comparison ran over more than three million people, each measured on twelve months of their own spend.
The finding, stated precisely: 21.3% of the customers who engaged ended those twelve months with an LTV at least a third above the median of the group that never engaged. The query returns one row per group, so the same measure exists for the non-engaged side. The contrast between the two is the argument, not the 21.3% on its own.
What this study could not prove. Engagement was a choice, not an assignment. Customers who enrol in their first month may simply be higher-intent to begin with, and no cohort comparison can rule that out. It was enough to reopen the budget conversation, and it is the reason the rebuilt programme was later measured against a holdout instead of a self-selected group. That test is in section 08.
The five premises the number stands on.
Change any one of these and the number changes with it, so they are worth stating plainly. This is the part a budget meeting should interrogate, not the query.
- Only new customers count. Everyone in the study had their first contract inside the same twelve-month intake window. A programme that looks good because it collects customers who were already loyal proves nothing about the programme.
- Engagement has to be early. Enrolment, a redemption or a tier change inside the first thirty days. Anything later and the two groups have already lived different lives, so the comparison stops being fair.
- Every customer is measured on their own clock. Twelve months counted from that customer's own first contract, not from a calendar year, so high season and low season fall on both groups equally.
- The bar is a median, not an average. The comparison point is the median twelve-month spend of customers who never engaged. An average would let a handful of heavy corporate accounts carry the whole result.
- Both groups are measured the same way. The same calculation runs on the engaged and the non-engaged side, so the contrast is something you can see rather than something I assert.
Built in SQL against the rental and loyalty tables, over more than three million customers. The query is available on request.
The segmentation
Nobody rents a car for the same reason. So nobody should get the same message.
With leadership behind the programme and budget released, the first move was not a campaign. It was finding out who was actually in the base, and when each of them was worth talking to.
The spine of it was RFV: how recently a customer spent, how often, and how much in total. On its own RFV tells you who is valuable, not why they rented, so I layered the contract attributes on top: rental duration, weekday against weekend, month of the year, and contract type. That is what separates a family renting for a week in July from someone taking a car for three days because their own is in the workshop.
Behaviour, not demographics. Four groups came out of it, and each one had its own calendar.
Family
December, January, July
Rents for seasonal holiday travel inside Brazil. Concentrated, predictable, and almost absent the rest of the year.
Corporate
All year, weekdays
Recurring business travel. The steadiest rhythm in the base, and the one most sensitive to friction.
Occasional
Weekends
Short trips, low frequency. The group where a single well-timed reason to come back is worth more than volume.
Maintenance
Whenever the car is in the shop
Rents to replace their own vehicle while it is being serviced. Unplanned, urgent, and easy to lose to whoever answers first.
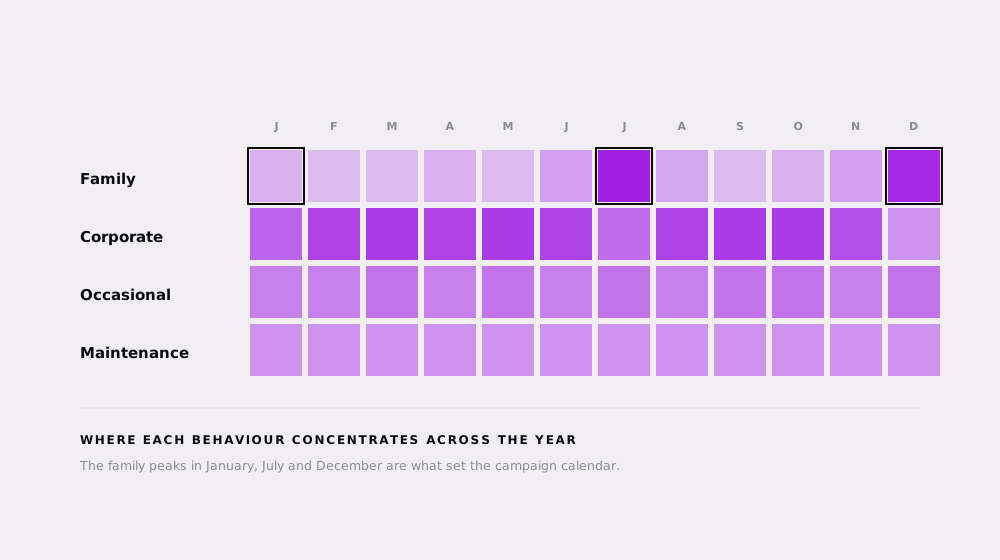
From there, each group got its own narrative. The same benefit reads differently to someone planning a holiday in November and to someone whose car is in the workshop today.
The outside view
Localiza brought in Mastercard Loyalty Consulting to pressure-test the rebuild.
Once the restructure had budget, the company hired Mastercard's consumer engagement and loyalty consulting practice, the same organisation behind Surpreenda, one of the best known loyalty programmes in Brazil. The point was not to be told what to do. It was to have the design challenged by people who had run one at scale.
- Programme design, tested before launch The method builds the design through customer research and workshops with the C-suite, instead of arriving with a finished answer.
- Financial modelling of the programme The economics are modelled so the programme drives incremental profitability, which is exactly the argument a budget review asks for.
- Journey mapping and diagnostics Strategic services covering programme design, diagnostics and customer journey mapping, on top of the loyalty platform itself.
- Behavioural data pointed at lifetime value Consumer and behavioural data used to find insight, predict trends and raise lifetime value. One published Mastercard relaunch lifted average order value 6.5% and the active rate 11%.
- Communication cadences. How often each group hears from the programme, through which channel, and what earns the right to the next message. This is where the four behaviour clusters stopped being an analysis and became a calendar.
- Benefit maths. What each benefit actually costs, what it is worth to the customer, and where the two stop lining up. A benefit nobody values is a cost with good intentions.
- Customer interviews. Real members, talking about what they thought the programme gave them. Some of it did not match what it actually gave them, and that gap was the useful part: it is a communication problem, not a benefit problem.
Mastercard consumer engagement and loyalty consulting. See the practice
What shipped
The ladder was already there. What changed was what it was made to do.
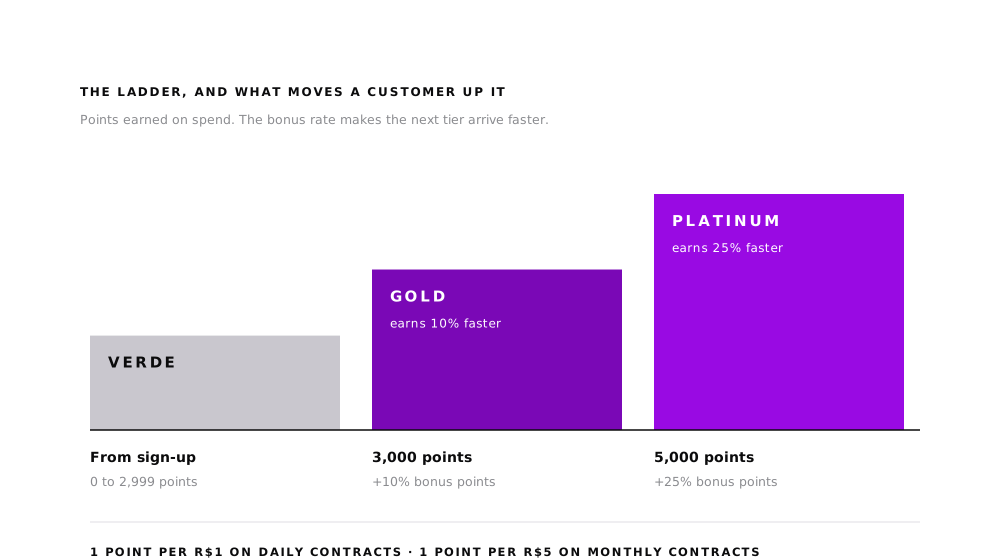
Verde, Gold and Platinum are the spine of a programme two decades old, and they were not invented here. The programme runs on points earned from spend: one point per real on daily contracts, one point per five reais on contracts of thirty days or more. Each tier both rewards the customer and makes the next one arrive faster.
The rebuild did not touch that structure. It changed what sat on top of it: which benefits were worth paying for, which parts of the business belonged inside the programme, and when each customer heard from it.
| Benefit | Verde | Gold | Platinum |
|---|---|---|---|
| Free day every 3,000 points | Yes | Yes | Yes |
| Express check-in | Yes | Yes | Yes |
| Return tolerance | 1 hour | 3 hours | 3 hours |
| Additional driver | No | 1 | 1 |
| Priority service | No | Yes | Yes |
| Loyalty upgrade | No | 1 | 3 |
| Choose the car model in the app | No | No | Yes |
| Exclusive transfer | No | No | Yes |
| Bonus points on every rental | No | +10% | +25% |
The ladder as Localiza publishes it today, shown for context rather than as authorship. The bonus rate is the part that compounds: a Platinum customer climbs faster than a Verde one spending the same amount.
- Benefits reworked against their cost Each advantage weighed against what it costs to serve and what a customer at that level actually values, which is where the benefit maths from the consultancy landed.
- The programme stopped being only about renting Other parts of the business came inside it, used-car purchase among them, which turned two separate relationships into one.
- Journeys from the first rental Communication starts at the first transaction instead of waiting for the customer to become interesting on their own.
- Campaigns tied to the calendar Each cluster approached at the moment its own behaviour says it is listening.
The emails
What the customer actually received.
The strategy only exists once it lands in an inbox. These are the pieces that carried the rebuilt programme: onboarding from the first rental, tier communication, the warning before a customer loses a level, and the last attempt before churn.
Written and shipped in Portuguese, personalised per customer, and built as journeys rather than one-off sends. Hover to scroll each one, or open it full size.









The result
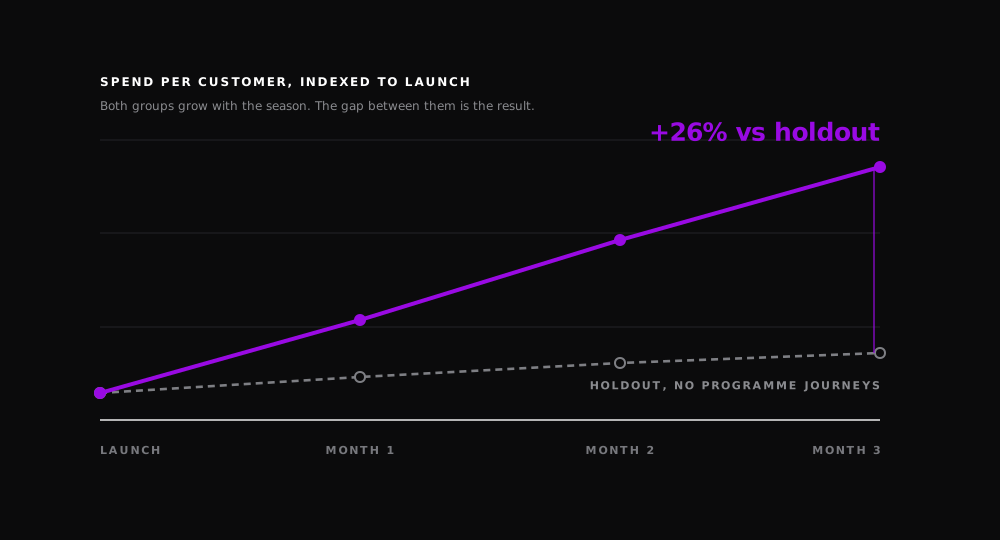
+26% in three months, against a holdout.
This is the test the cohort study could not be. Not a self-selected comparison, but a holdout: a group inside the same segments, kept out of the rebuilt journeys, measured against the group that received them.
The metric here is spend over the three months following launch, a different window from the twelve-month LTV in section 03. Over that quarter the group inside the programme grew 26% more than the holdout. The holdout grew too, as it should have, since the whole category moves with the season. The 26% is the distance between the two lines, not the height of one.
What I take from it
Loyalty work is not usually killed by bad campaigns. It gets killed in a budget meeting, by a number nobody has. Building the measurement first, on a base large enough that nobody could argue with the sample, is what bought the programme its second life.
The rest is the ordinary work: cluster on behaviour, respect the calendar that behaviour already follows, and start the relationship at the first transaction instead of the first campaign.